Data & Analytics Platforms
Business Intelligence Built Around Your Own Data
We connect data from relevant business sources and build analytics experiences for real-time visibility, predictive analysis, custom reporting, and decision support.
Your business has all the data it requires to make better decisions. We bring together, organize, and provide you with dashboards and actionable insights that will help you take action and not just read them.
"Transform operational data into actionable insights."
Our firm connects the data of your business and creates an analytics experience for you to have real-time visibility, predictive analysis, customized reporting, and decision support – so that insight comes from your data and not a cookie-cutter solution.
What We Build
Predictive Analytics
Models built using your own historical data to predict future demand, revenues, and risks. Models designed to learn from new data coming in over time rather than being one-time predictions.
Real-Time Analytics
Dashboards that refresh in real time based on changes in your data, not dashboards displaying the results from yesterday's data. Get real-time insights, not last week's.
Custom Reports
Reports that align with the metrics actually tracked by your teams and executives, rather than reports that require exporting to Excel and custom formatting.
Data Integration
Bringing your ERP, CRM, Finance, and Operational systems together. Eliminates the need to manually aggregate numbers from five different systems.
Capabilities
Data Pipelines
Data is automatically loaded from the source systems to a clean and structured format. This ensures that all dashboards and reports are based on the same set of clean data.
Analytics Dashboards
Real-time dashboards help the team to monitor performance without any need for a report. The team members can view their numbers whenever they want to.
Customized Reporting
The reports are created according to your KPIs and not according to a standard format that some other person has chosen. You save a lot of time by avoiding formatting.
Predictive Analysis
Past trends are analyzed and used to predict future trends. This allows the team to take action beforehand rather than after facing the issue.
Integrated Data View
All the data sources come together in an integrated view and there is no confusion about which figures are right because all the data comes from a single source.
How Data Becomes Insight
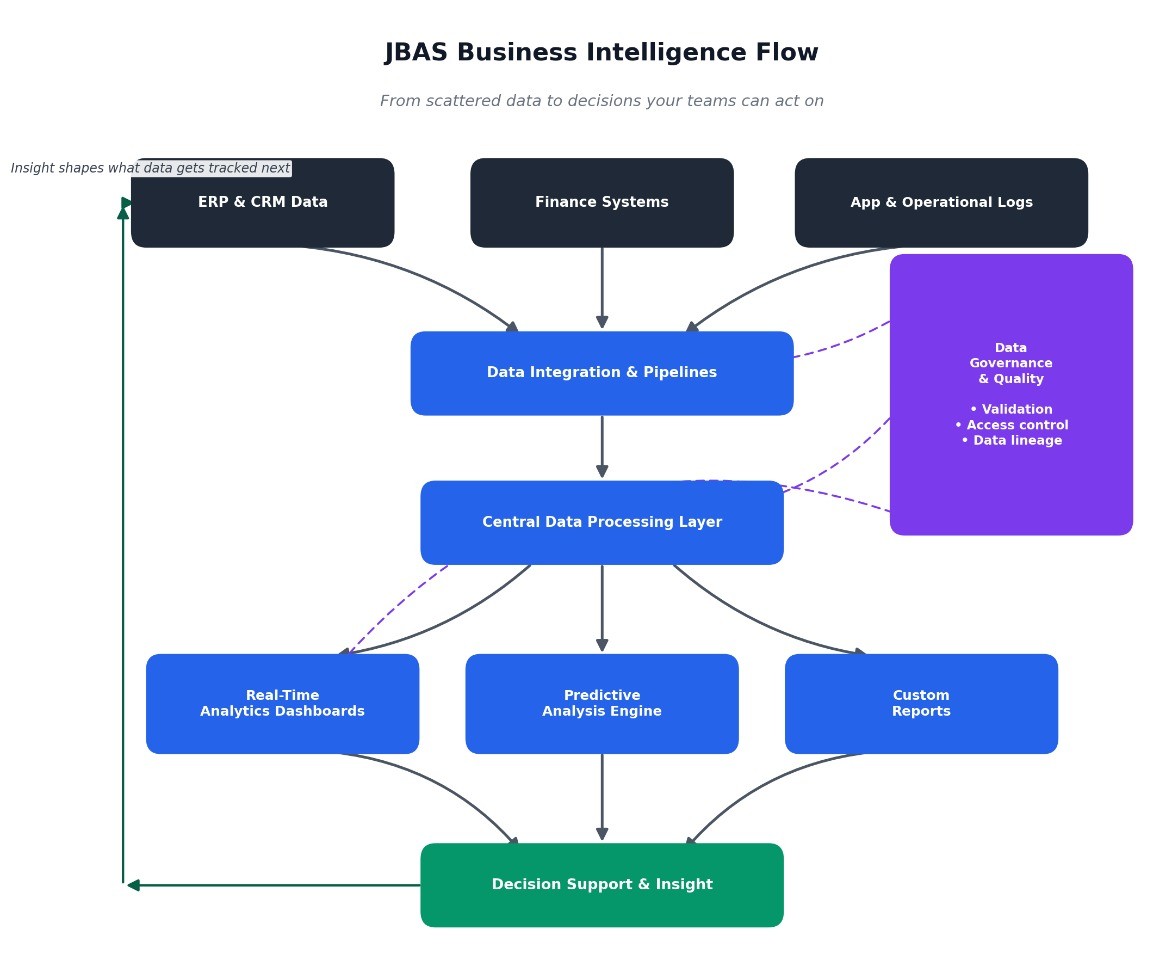
Data moves through the same structured path regardless of source, with governance and quality checks running throughout rather than only at the reporting stage. ERP, finance, and operational data are pulled into one integration layer, processed centrally, and split into real-time dashboards, predictive models, and custom reports — with the resulting insight shaping what data gets tracked and prioritized next.
Sub Services
Data Warehouse Creation
A central data warehouse is created to collect data from all the source systems you have.
Metrics and KPIs Setup
The metrics for you and your team are determined before any dashboard creation.
Legacy Report Transitioning
The legacy spreadsheets and static reports will be transformed into interactive and real-time dashboards.
Data Quality and Data Governance
Rules for validation and access rights ensure high quality and security of data in all the dashboards.
Dashboard Support Service
Our specialists will improve and update your dashboards as time goes by.
Technologies We Use
Apache Airflow & dbt - tools for data movement and transformation on schedule.
PostgreSQL, Snowflake, BigQuery depending on the size of the data and queries needed.
Power BI, Tableau and bespoke dashboards according to your team's workflow.
Python, scikit-learn and Tensorflow to train and improve forecasting models.
REST APIs & webhooks for collecting data from ERP, CRM & financial systems.
AWS & Azure with Role-Based Access Control for data security on all levels.
Benefits
Quicker Decisions: Teams react to live figures rather than waiting for someone to generate a report.
Single Source of Truth: Every team works off one integrated set of figures, putting an end to any disputes about which figures are correct.
Early Warning Signals: Predictive analysis reveals potential risks and changes in demand before the situation becomes critical.
Reduced Manual Reporting: Dashboards update automatically, sparing teams time reformatting figures in spreadsheets each month.
Better Resource Management: Insight into performance makes budgeting and staffing easier for management.
FAQs
What kind of data sources can this connect to?
It connects to your ERP, CRM, finance systems, and operational or application data sources.
Do we need a data team to maintain this after launch?
No, we set up the pipelines and dashboards to run with minimal ongoing effort from you.
Can dashboards be customized for different teams and roles?
Yes, dashboards are built around what each team actually needs to see and act on.
How accurate is the predictive analysis?
Accuracy improves as more historical data flows in, and models are tuned to your business.
How long does it take to get dashboards up and running?
Most builds take 6 to 10 weeks, depending on data sources and reporting needs.
Ready to implement data & analytics platforms?
Tell us a bit about what you need — our engineering team will get back to you to scope the project and next steps.